From the possible to the practical

Drawing intelligence from the complex tapestry of modern innovation threads

Get the ranking data

What is commercial, practical and works as ideas now and in the near future is built on the research and discovery of the near past. That means innovation and idea data across boundaries of basic and applied research are fundamental requirements for innovation decision making, whether academic or commercial.

It means those whose eyes stay fixed on the future horizon of the possible must consider both the scientifically possible and invented solution. Their expanded view means they more often transform ideas to knowledge and on to solution. Doing so changes the horizons they can see. It changes the horizons they can imagine. It changes the nature of our world and the solutions within it.

Where the threads go next are laid out at the edge of the great tapestry.

At the edge of what is possible.

arrow_forwardSee the methodology for Top 100

Top 100 Global Innovators past reports

Twelve years of measuring innovation excellence

Since 2011, we’ve explored the global innovation landscape. As global ideation pattern changes and the way they are measured evolves, so too has our methodology. Refreshed in 2022, our new model of innovation measurement focuses on consistent above-the-bar excellence where all ideas compete equally.

In this section, we offer the past five years of reports (since the inception of Clarivate™) as a complimentary resource for your reference.

Lighting a path to the possible

The creation of new knowledge can feel like a complex river. Filled with switchbacks, pools, eddies and rapids, science and engineering development finds a path from the discoveries of the enlightenment to the horizon of what may be possible.

Today, that flow of innovation is fed by vast numbers of tributaries, contributing ideas from many distinct pockets of research discipline.

At Clarivate, we have the privilege of witnessing that great pathway, visualizing it and helping to open it for the decision makers and innovators that lean on ideation data.

In that great river system, ideas transform and change, they morph from discovery to understanding of effects and outcome. They leave enticing opportunity, opening new directions for innovation itself.

Bringing together the information Clarivate has on both the inventive activity of humanity alongside the scientific discovery information of the world means we can track how technology, and the knowledge created with it, transfers. We can track how it graduates from what may be possible on to practical engineered solutions companies can build and supply.

Before the work and the ideas of Top 100 Global Innovators™ sits the research that carved a path to the possible – research referenced in the inventions of the Top 100 itself.

Here, we look before the Top 100 to the more fundamental science and engineering that – at least in part – enabled their work. We identify the 50 research organizations whose work is most often cited by the Top 100 Global Innovators 2023. Those institutions whose intellect underpins the design of engineered solutions.

Organization cited by the Top 100 Global Innovators 2023 Country/Region Number of papers referenced by inventions of
Top 100 Global Innovators 2023
Chinese Academy of Sciences China, Mainland 2,134
MIT United States 1,790
Stanford University United States 1,669
University of California, Berkeley United States 1,424
Harvard University United States 1,286
Tsinghua University China, Mainland 1,075
Nanyang Technological University Singapore 1,013
University of Michigan United States 973
University of California, San Diego United States 961
University of Toronto Canada 931
Seoul National University South Korea 887
GeorgiaTech United States 865
University of Illinois United States 819
TU Munich Germany 819
University of Washington United States 808
Carnegie Mellon University United States 801
UCLA United States 794
Alphabet United States 762
University of Texas, Austin United States 761
University of Melbourne Australia 760
University of Florida United States 754
National University of Singapore Singapore 753
Monash University Australia 715
University of Wisconsin United States 693
KAIST South Korea 693
Microsoft United States 688
University of Oxford United Kingdom 685
University College, London United Kingdom 670
Swiss Federal Institute of Technology Lausanne Switzerland 656
Rensselaer Polytechnic Institute United States 653
University of Maryland United States 641
Zhejiang University China, Mainland 635
Cornell University United States 631
University of Tokyo Japan 629
University of Cambridge United Kingdom 627
National Taiwan University Taiwan 624
Autonomous University of Barcelona Spain 612
Imperial College, London United Kingdom 608
University of California, Santa Barbara United States 607
Johns Hopkins University United States 604
Korea University South Korea 602
CNRS France 598
NYU United States 573
University of Pennsylvania United States 572
Peking University China, Mainland 565
RWTH Aachen University Germany 558
Hong Kong University of Science and Technology Hong Kong 556
Shanghai Jiao Tong University China, Mainland 542
Columbia University United States 540
Yale University United States 526

The source of the possible

The list of the Top 50 most cited institutions by the Top 100 Global Innovators is diverse.

Most prolific is the work of the institutions that make up the Chinese Academy of Sciences, while looking at the number of institutions across the Top 50, the pre-eminence of United States institutions is clear with half of the Top 50 being from the U.S.

The research landscape enabling downstream inventions is relatively concentrated geographically, with just four countries or regions with more than two organizations in the list: the United States, Mainland China, the United Kingdom and South Korea.

The United States, Mainland China and South Korea all have multiple corporations in Top 100 Global Innovators this year, while the United Kingdom has only one entry: Rolls Royce. This difference speaks to the power of the British research base, as it exports research and ideas around the world.

Most cited research, number of institutions by country/region Number of institutions in the top 50 most cited (tracking inventions from Top 100 Global Innovators 2023 to research articles)

The spectrum of research

When we broaden the review of invention-to-research paper links beyond the Top 100, to the Top 1,000 Global Innovators, we can see the intensity of research links, where bringing ideas to market are more tightly interwoven with the science and research within academia.

The top segment, as a function of citations to research per invention, is the pharmaceutical sector – reflecting the fundamental importance of life sciences research on the development of new drugs and therapies. It shows the need for broader thinking and the role of research in discovering new approaches. It also likely demonstrates the roughly 20-year trend towards academic-commercial research partnerships.

With the medical and biotechnology sector ranked fifth out of 15 in the same analysis, this effect clearly crosses into the wider life sciences industry.

Viewed at a higher level, the intensity of research linkage per sector shows a split between those that are more engineering related (automotive and aerospace, electronics and semiconductors, telecommunications) versus heavier science sectors (chemistry and materials science). One field which sits outside this general split is the energy and electrical sector, potentially reflecting the ongoing importance of academic research in the transition to more sustainable energy sources.

Finally, the entities in the Top 1,000 Global Innovators which are themselves research institutions demonstrate their direct transfer of ideas generated by their faculty members to commercially available inventions – with government and academic research ranked second in research link intensity.
Reliance on scientific research, by segment
Normalized citations to research articles per invention, by industry segment, from Top 1,000 Global Innovators 2023

Crossing boundaries

Interwoven in this analysis is the dissemination of research and innovation globally. Ideas do not see international borders. We can track the headquarters location of the Top 1,000 Global Innovators and the country/region location of the organization of the authors of the papers they cite. We can track when ideas cross those borders.

Doing so shows us how research ideas spread from region to region and the strength of the links between research in one region to the development of inventions in another.

This analysis primarily demonstrates the deep research links between Europe and the United States, with 5% of European inventions citing U.S. research papers and almost 11% of U.S. inventions citing European research.

The cross-border nature of research and developed idea flow has a good example in the Chinese Academy of Sciences, with 95% of the citations to the institutions that make up the academy coming from organizations not based in Mainland China.

Indeed, within this data, U.S. organizations that are members of the Top 1,000 Global Innovators cite Mainland Chinese research (2.7% of inventions) more often than the other way round (1% of inventions) – underscoring the emergence of Mainland China today as new and net source of ideas and innovation.

Top 1,000 Global Innovator entity region Citing Web of Science organization region Total times research is cited % of all Top 1,000 inventions with reference to research in other regions
East Asia (excl. Mainland China)

arrow_forward

arrow_forward

arrow_forward

Europe

Mainland China

United States

18,247

8,368

16,218

1.6%

0.7%

1.4%

Europe

arrow_forward

arrow_forward

arrow_forward

East Asia (excl. Mainland China)

Mainland China

United States

5,297

5,584

19,728

1.4%

1.5%

5.2%

Mainland China

arrow_forward

arrow_forward

arrow_forward

East Asia (excl. Mainland China)

Europe

United States

2,352

5,989

5,253

0.4%

1.1%

1.0%

United States

arrow_forward

arrow_forward

arrow_forward

East Asia (excl. Mainland China)

Europe

Mainland China

11,886

53,479

13,182

2.4%

10.8%

2.7%

Exploring new
territories

Countries and regions

Top 100 companies by region

Increase

No change

Decrease

Six companies re-enter the Top 100:

  • From the United States, Alphabet (parent company of Google and sister companies), Applied Materials, Emerson are all awarded Top 100 status once more
  • From Japan, Kawasaki Heavy Industries and Nichia return to the Top 100 for the first time since 2021
  • European semiconductor firm NXP Semiconductor re-enters the Top 100

Five companies awarded Top 100 Global Innovator status for the first time:

  • Mainland Chinese electronics company AAC Technologies
  • Taiwanese semiconductor firm Nanya Technology
  • Also from Taiwan, Winbond Electronics
  • From Japan, electric drive firm Nidec
  • From the United States, elevator manufacturer Otis Worldwide

Industry sectors

Aerospace and defense

6

Automotive

10

Chemical and materials

11

Consumer goods and food

4

Electronics and computing equipment

26

Energy and electrical

5

Government and academic research

3

Industrial conglomerate

8

Industrial systems

8

Medical and biotechnology

1

Mining and metals

-

Pharmaceuticals

2

Semiconductors

11

Software, media and fintech

2

Telecommunications

3

Increase

No change

Decrease

19 companies retain all-year Top 100 Global Innovator status:

  • 3M
  • Boeing
  • Dow
  • Ericsson
  • Fujitsu
  • GE
  • Hitachi
  • Honda
  • Honeywell
  • LG
  • NEC
  • Panasonic
  • Qualcomm
  • Roche
  • Samsung
  • Shin-Etsu chemical
  • Sony
  • Toshiba
  • Toyota

Three industrial segments saw increases in Top 100 Global Innovators representation: semiconductors (+3), chemicals and materials (+1) and industrial conglomerates (+1), offset by decreases in automotive firm representation (-2), electronics and computing equipment (-2) and the energy and electrical segment (-1). All other industrial segments remained static to 2022 levels.

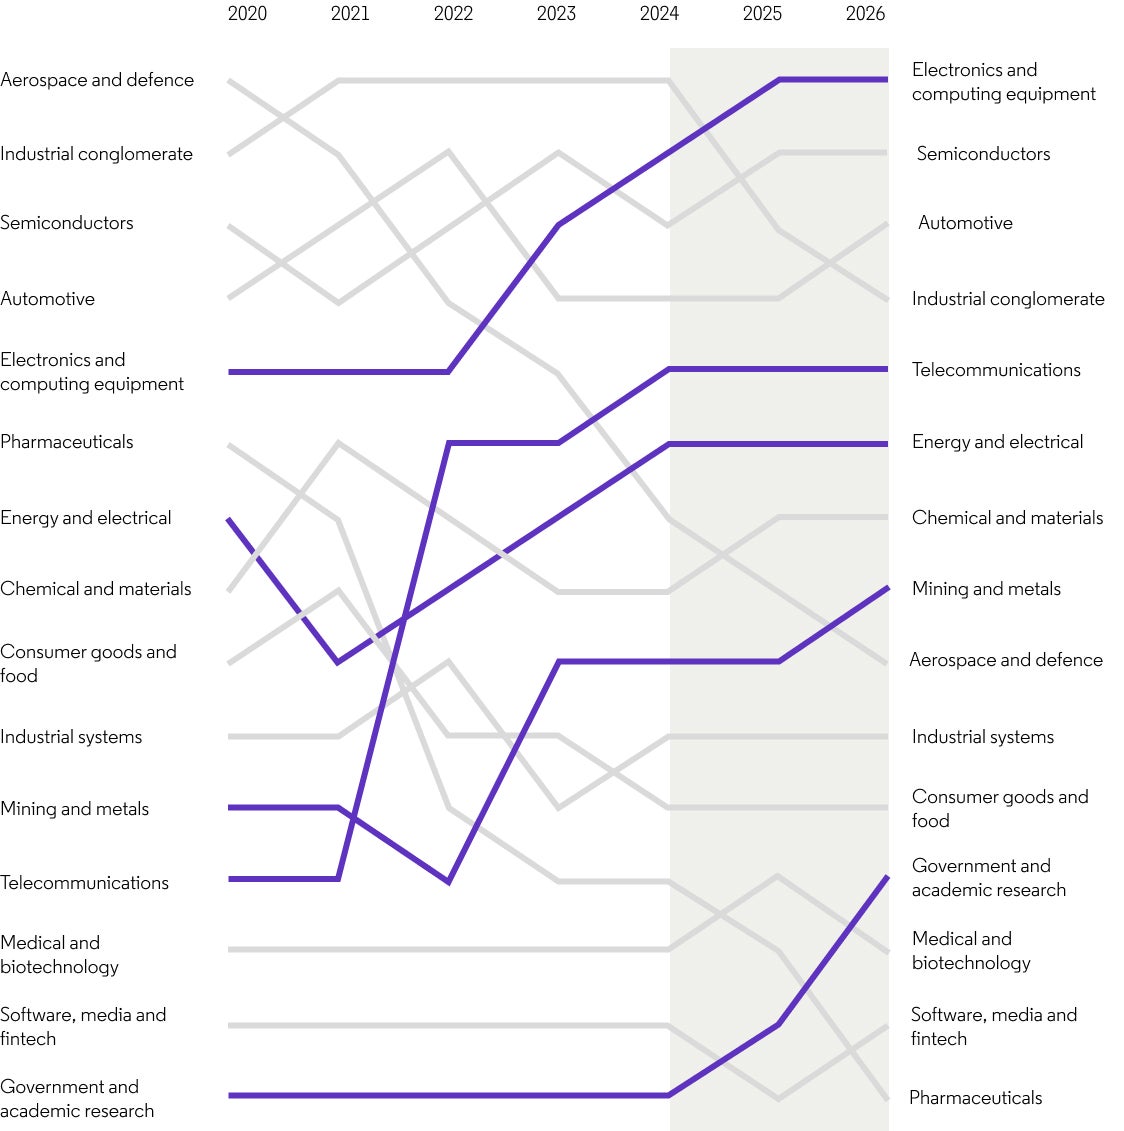
The trends within the Top 100 differ from wider trends across the broader Top 1,000 Global Innovators. Our over-the-horizon view of current average rankings by sector forecasts continued increases in rank of connectivity and sustainability focused industries: telecommunications, energy and electrical-focused entities and computing equipment.

Forecast global innovator ranking, by segment
Average rank of organizations within Top 1,000 Global Innovators; displayed as position

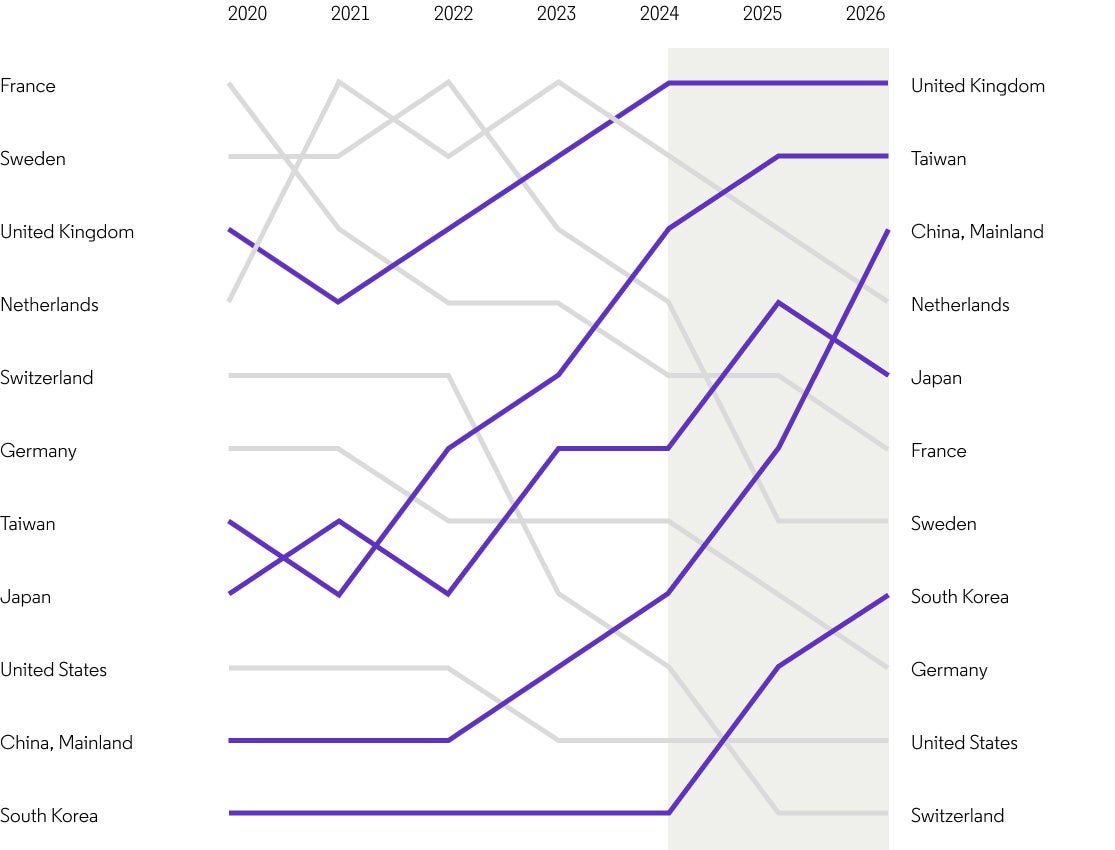
Forecast global innovator ranking, by country/region
Average rank of organizations within Top 1,000 Global Innovators; only countries/region with <10 entities in year; displayed as position

This year, we see a potential acceleration in the average ranking of government and academic institutions – currently ranked 15th out of 15 segments, but on a pathway to 12th place in future years, based on current ranking changes by organizations.

Geographically, while Mainland China saw a reduction in Top 100 representation this year, we did see an increase in the wider spread among a much broader pool of entities across the Top 1,000 rankings. This context better represents overall Mainland Chinese innovation trends, which continue to demonstrate average ranking improvement. That signal is sharper in 2023, with a faster acceleration in innovation metrics even as volumes of invention activity from the region continue to increase.

Indeed, Asia Pacific regions and nations are showing similar performance increases: South Korea, Taiwan and Japan all show average entity ranking increases.

More on Top 100 Global Innovators 2023

Intelligence to transform innovation

At Clarivate, we aim to provide the guidance and the clarity to understand and take advantage of the complex. To use the techniques, the information and the expertise behind the Top 100, contact us today.

Talk to an expert