
London, UK — August 6, 2024 Clarivate Plc (NYSE: CLVT) (the “Company” or “Clarivate”), a leading global provider of transformative intelligence, today reported results for the second quarter ended June 30, 2024.
Second Quarter 2024 Financial Highlights
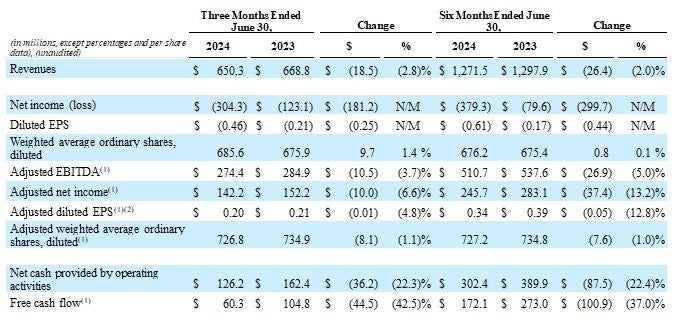
- Revenues of $650.3 million decreased 2.8%
- Organic revenues decreased 0.6%, as an increase in subscription revenues of 0.7% was offset by a decrease in re-occurring revenues of 0.7% and transactional and other revenues of 4.1%
- Net loss of $304.3 million; Net loss per diluted share of $0.46
- Adjusted net income(1) of $142.2 million decreased 6.6%; Adjusted diluted EPS(1) of $0.20 decreased 4.8% or $0.01
- Adjusted EBITDA(1) of $274.4 million decreased 3.7%; Adjusted EBITDA margin(1) of 42.2% decreased 40 basis points primarily due to lower revenues
- Net cash provided by operating activities of $126.2 million decreased $36.2 million; Free cash flow(1) of $60.3 million decreased $44.5 million primarily due to the timing of working capital
Six Months Ended June 30, 2024 Financial Highlights
- Revenues of $1,271.5 million decreased 2.0%
- Organic revenues decreased 1.1% as an increase in subscription revenues of 1.5% was offset by a decline in re-occurring revenues of 2.9% and transactional and other revenues of 7.3%
- Net loss of $379.3 million; Net loss per diluted share of $0.61
- Adjusted net income(1) of $245.7 million decreased 13.2%; Adjusted diluted EPS(1) of $0.34 decreased 12.8% or $0.05
- Adjusted EBITDA(1) of $510.7 million decreased 5.0%; Adjusted EBITDA margin(1) of 40.2% decreased 120 basis points primarily due to lower revenues
- Net cash provided: With our strong cash flow, we plan to take a more balanced approach to capital allocation during the second half of 2024. by operating activities decreased $87.5 million to $302.4 million; Free cash flow(1) decreased $100.9 million to $172.1 million primarily due to lower operating income and increased capital expenditures
“We continue to invest in innovation and make progress on our strategy of returning to growth. During the last quarter, we launched several new, next-generation product offerings across all three segments such as the Research Horizon Navigator™, Trademark Watch Analyzer, and Epidemiology Intelligence,” said Jonathan Gear, Chief Executive Officer. “We are seeing our customers respond positively to our operational and product improvements, and as a result improved renewal rates and new customer wins, which will drive a return to organic growth in the second half of this year.”
Selected Financial Information
Second Quarter 2024 Commentary
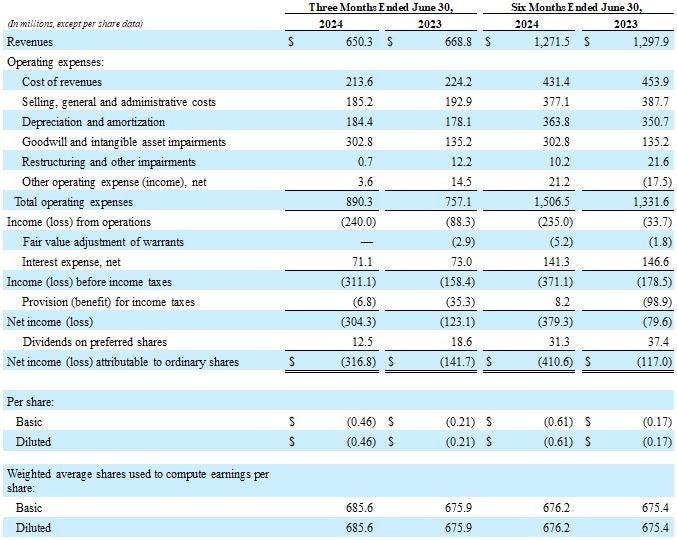
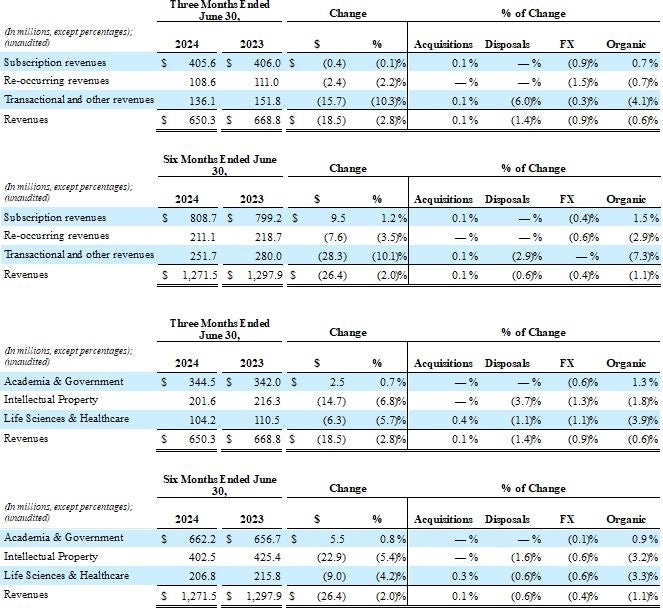
Revenues for the second quarter decreased $18.5 million, or 2.8%, to $650.3 million, primarily due to the divestiture of Valipat in April 2024 and the negative impact of foreign exchange as a result of the strengthening of the U.S. dollar. Organic revenues decreased $3.9 million or 0.6%.
Subscription revenues for the second quarter decreased $0.4 million, or 0.1%, to $405.6 million. Organic subscription revenues increased 0.7%, driven by price increases.
Re-occurring revenues for the second quarter decreased $2.4 million, or 2.2%, to $108.6 million. Organic re-occurring revenues decreased 0.7%, primarily due to lower IP patent renewal volumes.
Transactional and other revenues for the second quarter decreased $15.7 million, or 10.3%, to $136.1 million. Organic transactional and other revenues decreased 4.1%, due to lower sales across all three segments.
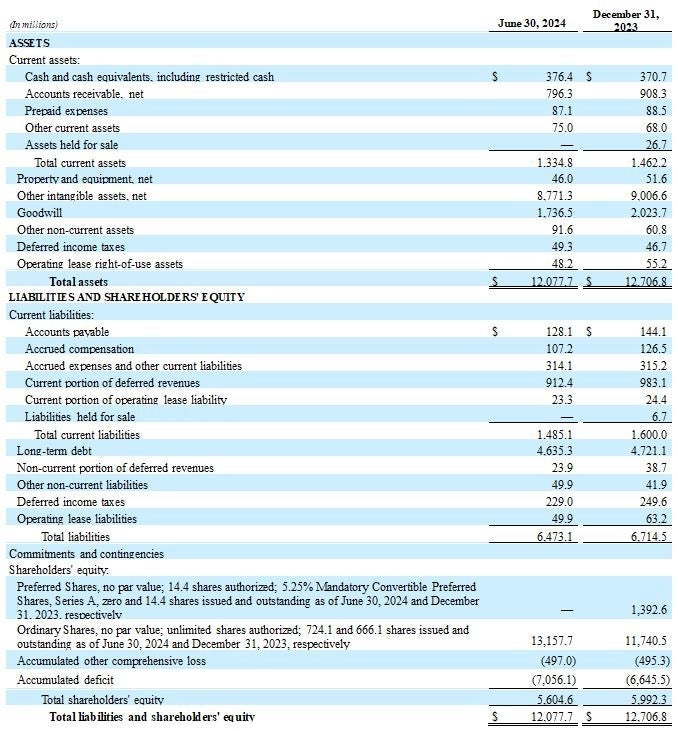
Balance Sheet and Cash Flow
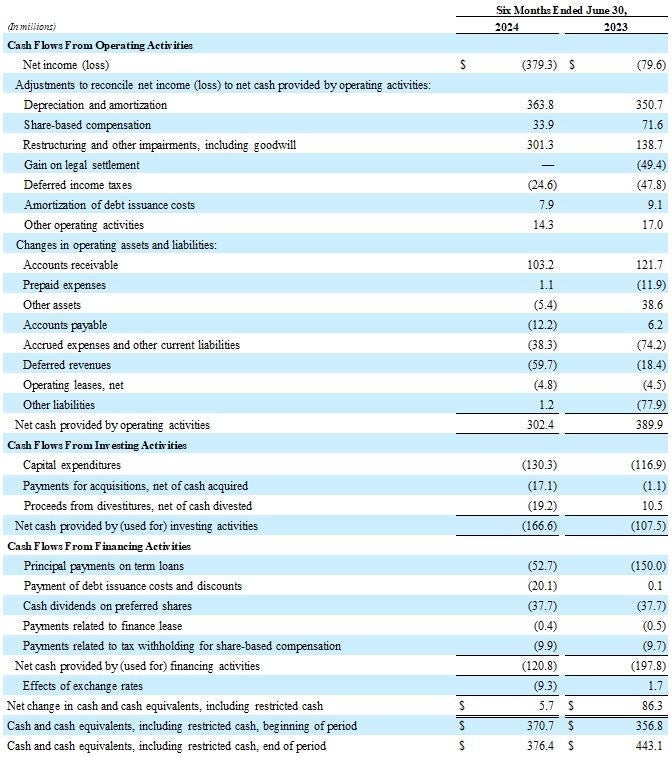
As of June 30, 2024, cash and cash equivalents of $376.4 million increased $5.7 million compared to December 31, 2023.
The Company’s total debt outstanding as of June 30, 2024 was $4,717.2 million, a decrease of $53.1 million compared to December 31, 2023, driven by an accelerated debt repayment.
Net cash provided by operating activities of $302.4 million for the six months ended June 30, 2024 decreased $87.5 million compared to the prior year period, primarily due to timing differences in working capital. Free cash flow(1) for the six months ended June 30, 2024 was $172.1 million, a decrease of $100.9 million compared to the prior year period.
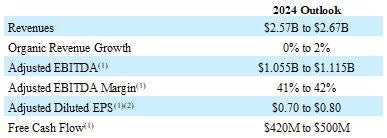
Reaffirmed Outlook for 2024 (forward-looking statement)
“Our second quarter results were in line with the expectations we outlined on our prior earnings call. We continue to expect our full year 2024 financial results to be in the range of our existing outlook,” said Jonathan Collins, Executive Vice President and Chief Financial Officer. “With our strong cash flow, we plan to take a more balanced approach to capital allocation during the second half of 2024.”
The full year outlook presented below assumes no further acquisitions, divestitures, or unanticipated events.
Notes to earnings press release
(1) Non-GAAP measure. Please see “Reconciliations to Certain Non-GAAP Measures” in this earnings release for important disclosures and reconciliations of these financial measures to the most directly comparable GAAP measure. These terms are defined elsewhere in this earnings release.
(2) Adjusted diluted EPS for 2024 is calculated based on approximately 725 million fully diluted adjusted weighted average ordinary shares outstanding.
N/M – Represents a change approximately equal or in excess of 100% or not meaningful.
Conference Call and Webcast
Clarivate will host a conference call and webcast today to review the results for the second quarter at 9:00 a.m. Eastern Time. The webcast is open to all interested parties and may include forward-looking information.
The live webcast of the earnings call will be accessible through the investor relations section of the Company’s website. To join the webcast, please visit https://events.q4inc.com/attendee/625167177.
Interested parties may access the live audio broadcast by dialing +1 404-975-4839 or toll-free +1 833-470-1428 (in North America) and +44 208 068 2558 or toll free +44 808 189 6484 (internationally). The conference ID number is 274546.
A replay of the webcast will also be available on https://ir.clarivate.com beginning two hours after the conclusion of the live call and will remain available for one year.
Use of Non-GAAP Financial Measures
Non-GAAP results are financial measures that are not prepared in accordance with U.S. generally accepted accounting principles (“GAAP”) and are presented only as a supplement to our financial statements based on GAAP. Non-GAAP financial information is provided to enhance the reader’s understanding of our financial performance, but none of these non-GAAP financial measures are recognized terms under GAAP. They are not measures of financial condition or liquidity, and should not be considered as an alternative to profit or loss for the period determined in accordance with GAAP or operating cash flows determined in accordance with GAAP. As a result, you should not consider such measures in isolation from, or as a substitute for, financial measures or results of operations calculated or determined in accordance with GAAP.
We use non-GAAP measures in our operational and financial decision-making. We believe that such measures allow us to focus on what we deem to be a more reliable indicator of ongoing operating performance and our ability to generate cash flow from operations, and we also believe that investors may find these non-GAAP financial measures useful for the same reasons. Non-GAAP measures are frequently used by securities analysts, investors, and other interested parties in their evaluation of companies comparable to us, many of which present non-GAAP measures when reporting their results. These measures can be useful in evaluating our performance against our peer companies because we believe the measures provide users with valuable insight into key components of GAAP financial disclosures. However, non-GAAP measures have limitations as analytical tools and because not all companies use identical calculations, our presentation of non-GAAP financial measures may not be comparable to other similarly titled measures of other companies.
Definitions and reconciliations of non-GAAP measures, such as Adjusted EBITDA, Adjusted EBITDA margin, Adjusted net income, Adjusted diluted EPS, and Free cash flow to the most directly comparable GAAP measures are provided within the schedules attached to this release. Our presentation of non-GAAP measures should not be construed as an inference that our future results will be unaffected by any of the adjusted items, or that any projections and estimates will be realized in their entirety or at all.
Forward-Looking Statements
This communication includes statements that express our opinions, expectations, beliefs, plans, objectives, assumptions, or projections regarding future events or future results and therefore are, or may be deemed to be, “forward-looking statements” within the meaning of the “safe harbor provisions” of the Private Securities Litigation Reform Act of 1995. These forward-looking statements can generally be identified by the use of forward-looking terminology, including the terms “believes,” “estimates,” “anticipates,” “expects,” “seeks,” “projects,” “intends,” “plans,” “may,” “will,” or “should” or, in each case, their negative or other variations or comparable terminology. These forward-looking statements include all matters that are not historical facts, and include statements regarding our intentions, beliefs, or current expectations concerning, among other things, anticipated cost savings, results of operations, financial condition, liquidity, prospects, growth, strategies, and the markets in which we operate. Such forward-looking statements are based on available current market material and management’s expectations, beliefs, and forecasts concerning future events impacting us. There can be no assurance that future developments affecting us will be those that we have anticipated. These forward-looking statements involve a number of risks and uncertainties (some of which are beyond our control) or other assumptions that may cause actual results or performance to be materially different from those expressed or implied by these forward-looking statements. These risks and uncertainties include, but are not limited to, those factors described in Item 1A. Risk Factors of our annual report on Form 10-K. Should one or more of these risks or uncertainties materialize, or should any of the assumptions prove incorrect, actual results may vary in material respects from those projected in these forward-looking statements. We do not undertake any obligation to update or revise any forward-looking statements, whether as a result of new information, future events or otherwise, except as may be required under applicable securities laws. Please consult our public filings with the SEC or on our website at www.clarivate.com.
About Clarivate
Clarivate™ is a leading global provider of transformative intelligence. We offer enriched data, insights & analytics, workflow solutions and expert services in the areas of Academia & Government, Intellectual Property and Life Sciences & Healthcare. For more information, please visit www.clarivate.com.
Condensed Consolidated Statements of Operations (Unaudited)
Condensed Consolidated Statements of Cash Flows (Unaudited)
Condensed Consolidated Statements of Cash Flows (Unaudited)
Supplemental Revenues Information
Annualized contract value (“ACV”) represents the annualized value for the next 12 months of subscription-based client license agreements, assuming that all expiring license agreements during that period are renewed at their current price level. Our ACV was $1,591.8 and $1,567.2 as of June 30, 2024 and 2023, respectively, which corresponds to an increase of 1.6%. The increase in ACV was primarily due to the impact of price increases.
The following tables present our revenues by type and by segment for the periods indicated, as well as the drivers of the variances between periods, including as a percentage of such revenues.
Reconciliations to Certain Non-GAAP Measures
Adjusted EBITDA and Adjusted EBITDA Margin
Adjusted EBITDA represents Net income (loss) before the Provision (benefit) for income taxes, Depreciation and amortization, and Interest expense, net, adjusted to exclude acquisition and/or disposal-related transaction costs, share-based compensation, unrealized foreign currency gains/losses, restructuring expenses, non-operating income and/or expense, the impact of certain non-cash fair value adjustments on financial instruments, legal settlements, impairments, and other items that are included in Net income (loss) for the period that we do not consider indicative of our ongoing operating performance. Net income (loss) margin is calculated by dividing Net income (loss) by Revenues. Adjusted EBITDA margin is calculated by dividing Adjusted EBITDA by Revenues.
The following table presents our calculation of Adjusted EBITDA and Adjusted EBITDA margin for the three and six months ended June 30, 2024 and 2023 and reconciles these non-GAAP measures to our Net income (loss) and Net income (loss) margin for the same periods:
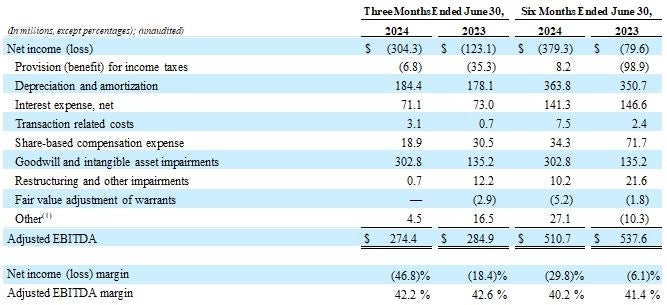
Adjusted EBITDA margin 42.2 % 42.6 % 40.2 % 41.4 %
(1) Primarily reflects the net impact of foreign exchange gains and losses related to the remeasurement of balances and other items that do not reflect our ongoing operating performance. In addition to the net unrealized foreign exchange loss, the six months ended June 30, 2024 also includes a $14.8 loss on divestiture and the six months ended June 30, 2023 includes a $49.4 gain on legal settlement.
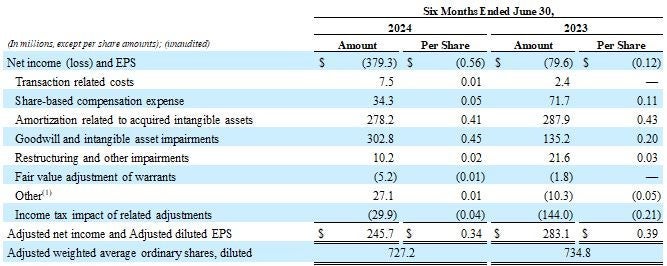
Adjusted net income and Adjusted diluted EPS
Adjusted net income is calculated using Net income (loss), adjusted to exclude acquisition and/or disposal-related transaction costs (such costs include net income from continuing operations before the provision for income taxes, depreciation and amortization, and interest income and expense from the divested business), amortization related to acquired intangible assets, share-based compensation, unrealized foreign currency gains/losses, restructuring expenses, the impact of certain non-cash fair value adjustments on financial instruments, legal settlements, impairments, and other items that are included in net income (loss) for the period that we do not consider indicative of our ongoing operating performance and the income tax impact of any adjustments.
Adjusted diluted EPS is calculated by dividing Adjusted net income by Adjusted diluted weighted average shares for the period. The Adjusted diluted weighted average shares assumes that all instruments in the calculation are dilutive.
The following tables present our calculation of Adjusted net income and Adjusted diluted EPS for the three and six months ended June 30, 2024 and 2023 and reconciles these non-GAAP measures to our Net income (loss) and diluted EPS for the same periods:
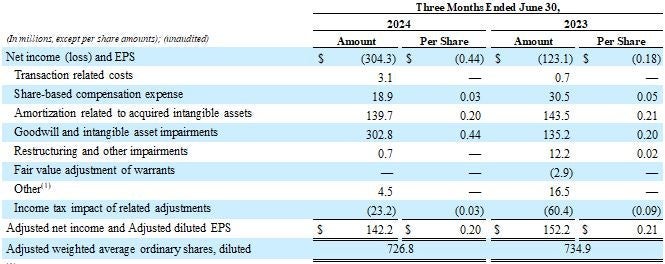
(1) Primarily reflects the net impact of foreign exchange gains and losses related to the remeasurement of balances and other items that do not reflect our ongoing operating performance.
(1) Primarily reflects the net impact of foreign exchange gains and losses related to the remeasurement of balances and other items that do not reflect our ongoing operating performance. In addition to the net unrealized foreign exchange loss, the six months ended June 30, 2024 also includes a $14.8 loss on divestiture and the six months ended June 30, 2023 includes a $49.4 gain on legal settlement.
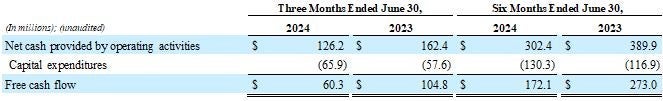
Free cash flow
Free cash flow is calculated using Net cash provided by operating activities less Capital expenditures. The following table reconciles this non-GAAP measure to Net cash provided by operating activities:
Reconciliations to Certain Non-GAAP Measures – 2024 Outlook
Adjusted EBITDA and Adjusted EBITDA Margin
The following table presents our calculation of Adjusted EBITDA and Adjusted EBITDA margin for the 2024 outlook and reconciles these non-GAAP measures to our Net income (loss) and Net income (loss) margin for the same period:
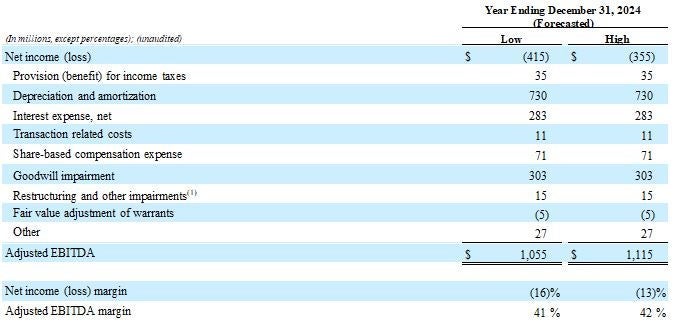
Adjusted EBITDA margin 41 % 42 %
(1) Reflects restructuring costs expected to be incurred in 2024 associated with the Segment Optimization restructuring program.
Adjusted diluted EPS
The following table presents our calculation of Adjusted diluted EPS for the 2024 outlook and reconciles this non-GAAP measure to our per share Net income (loss) for the same period:
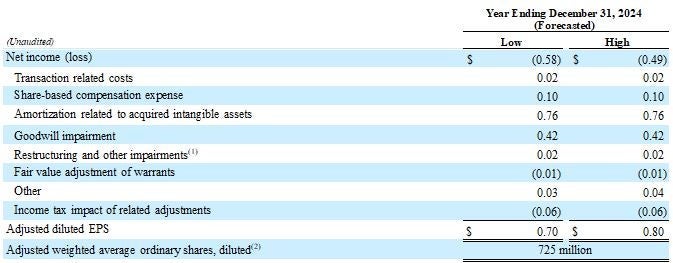
(1) Refer to associated line item descriptions provided for the Adjusted EBITDA outlook reconciliation table above.
(2) For the purposes of calculating Adjusted diluted EPS, we have assumed the “if-converted” method of share dilution on a full year basis.
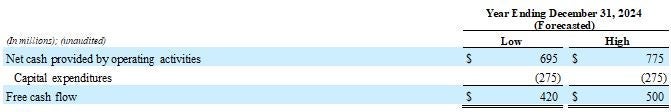
Free cash flow
The following table presents our calculation of Free cash flow for the 2024 outlook and reconciles this non-GAAP measure to our Net cash provided by operating activities for the same period:
Media Contact:
Amy Bourke-Waite, Senior Director, Corporate Communications
newsroom@clarivate.com
Investor Relations Contact:
Mark Donohue, Vice President, Investor Relations
investor.relations@clarivate.com
215-243-2202


