
Reaffirms Outlook for 2019
- Revenues, net of $242.3 million, down 0.4% on reported basis and up 0.4% at constant currency
- Adjusted Revenues of $242.4 million, up 1.7% on reported basis and up 2.5% at constant currency
- Subscription revenues of $202.7 million, up 2.4% at constant currency
- Adjusted Subscription revenues of $202.7 million, up 4.9% at constant currency
- Net loss of $77.8 million compares to $66.9 million
- Adjusted EBITDA of $73.2 million, up 8.4% on reported basis
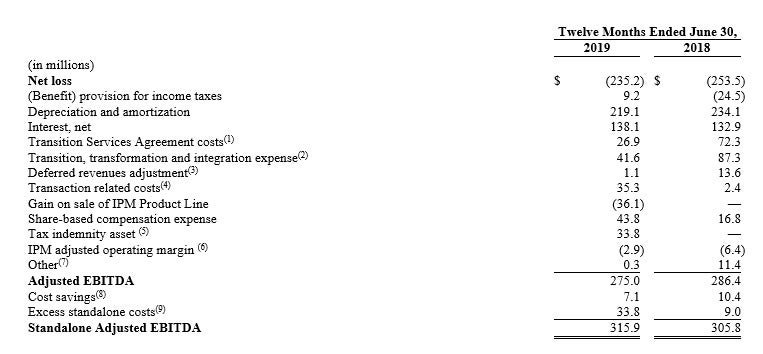
- LTM Standalone Adjusted EBITDA of $315.9 million, up 3.3% on reported basis
- Annual contract value of subscription-based agreements $782.6 million, up 3.6% at constant currency
London, UK and Philadelphia, US – – (PRN Newswire) — August 7, 2019 – Clarivate Analytics Plc (NYSE: CCC, CCC.WS) (the “Company” or “Clarivate”), a global leader in providing trusted insights and analytics to accelerate the pace of innovation, today reported results for the second quarter ended June 30, 2019.
“We are very pleased with our financial results this quarter, our first full quarter as a public company,” said Jerre Stead, Executive Chairman and CEO of Clarivate. “Increases in subscription revenues and in Annual Contract Value (ACV), combined with steady revenue renewal rates all contributed to the growth this quarter. Since completing the merger with Churchill Capital Corporation in May, we shifted focus to execute against our strategic initiatives to drive revenue growth, improve colleague engagement, and delight our customers through outstanding service, while optimizing our business structure for the long-term. I am very excited about the potential that lies ahead, as we position the company for future growth and profitability.”
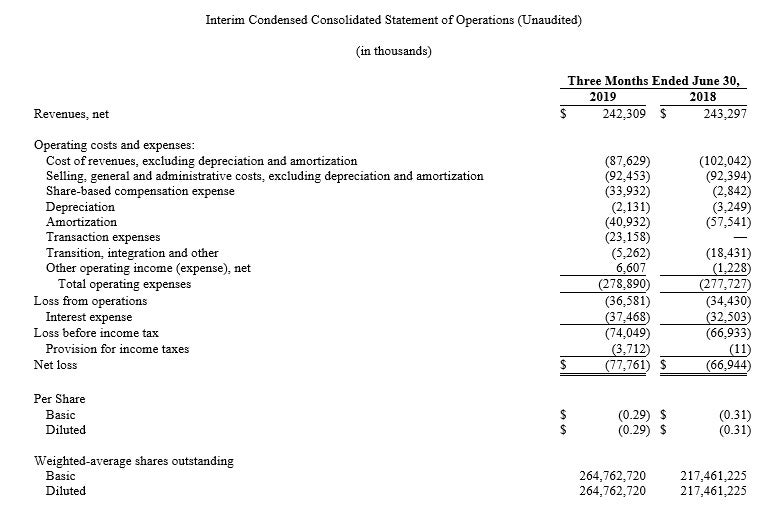
Second-Quarter Fiscal 2019 Operating Results
Revenues, net decreased by 0.4% to $242.3 million for the second quarter 2019, from $243.3 million for the three months ended June 30, 2018. On a constant currency basis, revenues, net increased 0.4% for the second-quarter 2019.
Adjusted Revenues, which exclude the impact of the deferred revenues adjustment and revenues from the IPM Product Line prior to its date of divestiture, increased 1.7% to $242.4 million in the second quarter 2019 from $238.4 million in the prior-year period. On a constant currency basis, Adjusted Revenues increased 2.5% in the second quarter of 2019. Subscription revenues increased by 1.6% for the second quarter of 2019 and on a constant currency basis, increased by 2.4%. Adjusted subscription revenues increased by 4.1% for the second quarter 2019 and, on a constant currency basis, increased by 4.9%. The increase in adjusted subscription revenues is primarily due to price increases and new business within both the Science Product Group and IP Product Group. Transactional revenues decreased by 11.2% for the second quarter and, on a constant currency basis, decreased 10.3%. Adjusted transactional revenues decreased by 9.2% for the second quarter 2019 and, on a constant currency basis, decreased by 8.2%. The decline in adjusted transactional revenues reflect timing and our product and sales strategy to change the mix in favor of subscription product offerings within the IP Product Group.
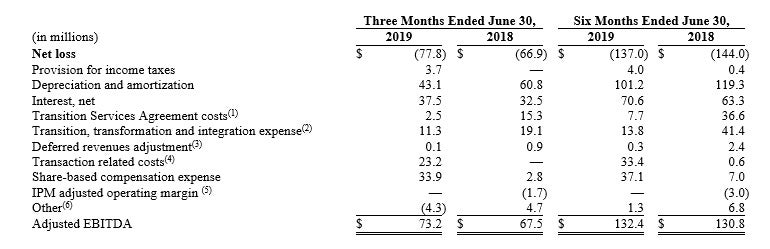
Adjusted EBITDA increased by 8.4% to $73.2 million for the three months ended June 30, 2019.
Net loss of $77.8 million, or $0.29 per share, for the second quarter 2019, compares with a net loss of $66.9 million, or $0.31 per share, in the prior-year period.
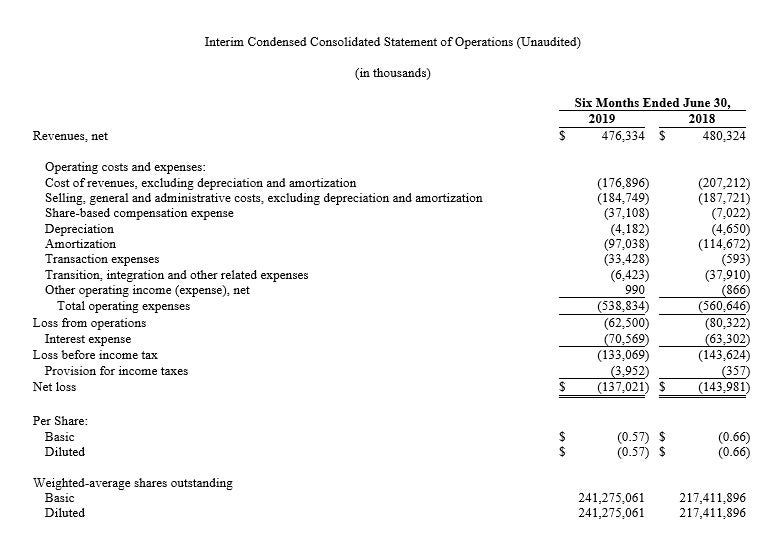
Six Months Ended June 30, 2019 Operating Results
Revenues, net decreased by 0.8%, from $480.3 million for the six months ended June 30, 2018 to $476.3 million for prior-year period. On a constant currency basis, Revenues, net increased by 0.1% for the six months ended June 30, 2019.
Adjusted Revenues increased by 1.4%, to $476.6 million for the six months ended June 30, 2019, compared with $470.2 million for prior-year period. On a constant currency basis, Adjusted Revenues increased 2.4% for the six months ended June 30, 2019. Subscription revenues increased by 0.8% for the six months ended June 30, 2019 and on a constant currency basis increased 1.7%. Adjusted subscription revenues increased by 3.6% for the six months ended June 30, 2019 and, on a constant currency basis, increased by 4.6%. Adjusted subscription revenues from ongoing business increased primarily due to price increases and new business within the Science Product Group and IP Product Group. Transactional revenues decreased by 10.2% for the six months ended June 30, 2019, and on a constant currency basis decreased by 8.9%. Adjusted transactional revenues decreased by 8.3% for the six months ended June 30, 2019. On a constant currency basis, adjusted transactional revenues decreased by 7.1%. The decline in adjusted transactional revenues reflect timing and our product and sales strategy to change the mix in favor of subscription product offerings within the IP Product Group.
Adjusted EBITDA increased 1.2% to $132.4 million for the six months ended June 30, 2019.
Net loss of $137.0 million, or $0.57 per share for the six months ended June 30, 2019, compares with a net loss of $144.0 million, or $0.66, in the prior-year period.
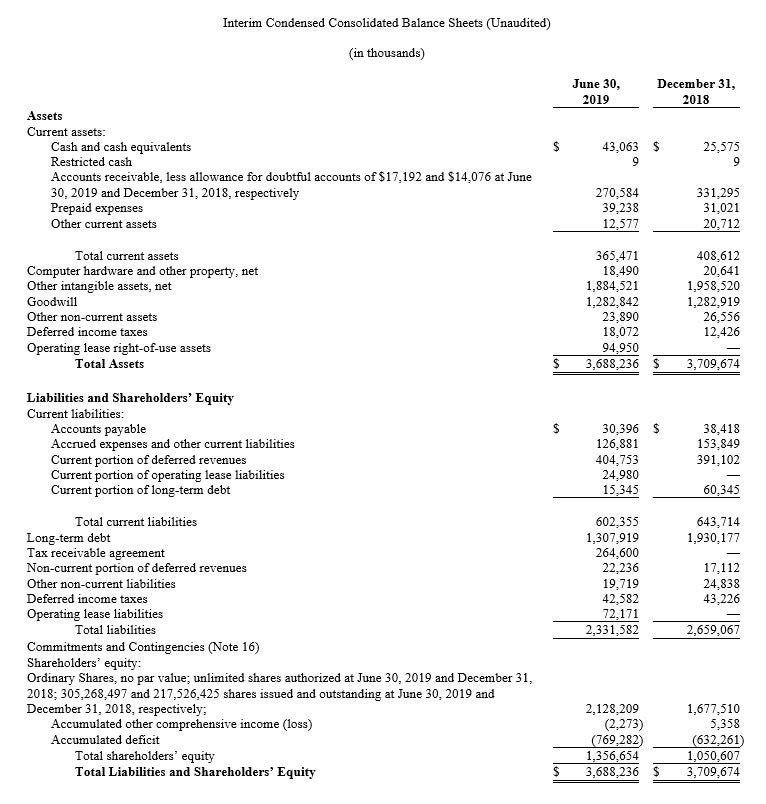
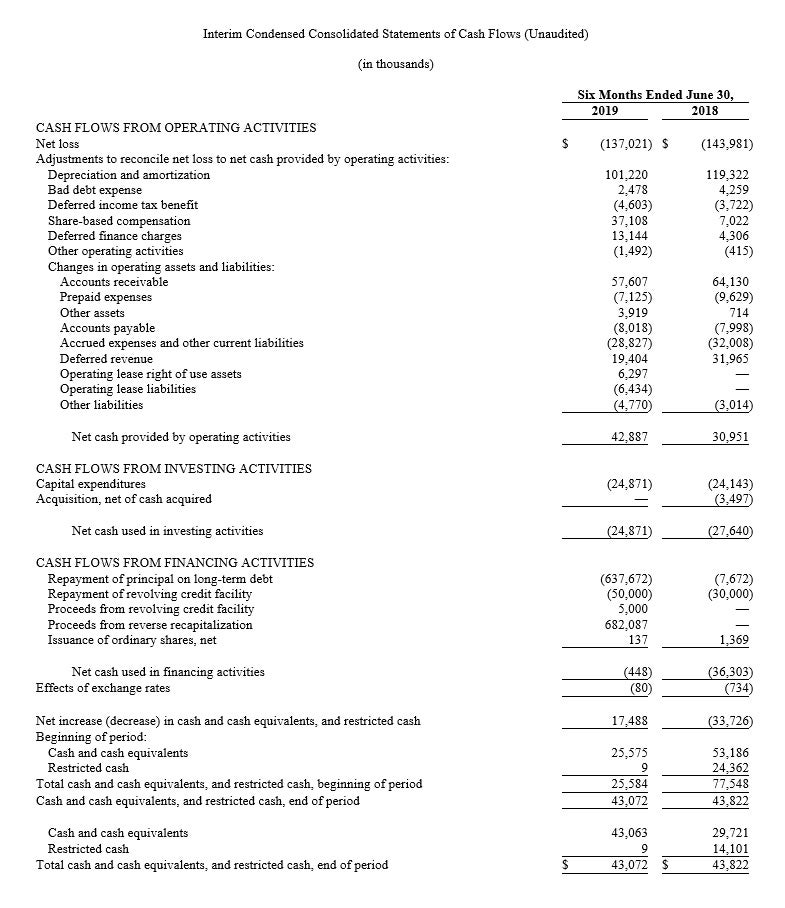
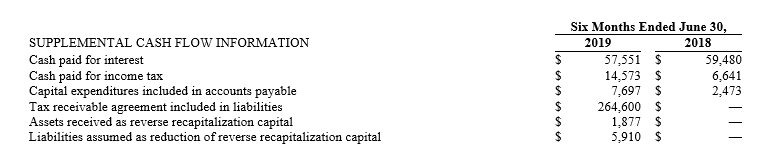
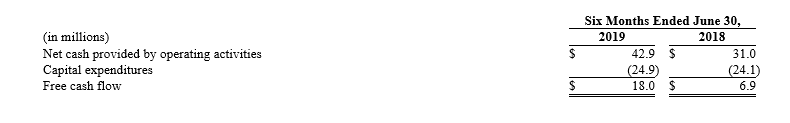
At June 30, 2019 cash and cash equivalents were $43.1 million and total debt outstanding was $1,346.3 million, resulting in net debt of $1,303.2 million. Net cash provided by operating activities was $42.9 million for the six months ended June 30, 2019, compared to $31.0 million for the prior year period. Net cash used in investing activities was $24.9 million for the six months ended June 30, 2019, compared to $27.6 million for the prior year period. Net cash used in financing activities was $0.4 million for the six months ended June 30, 2019, compared to $36.3 million for the prior year period. Free cash flow was $18.0 million for the six months ended June 30, 2019, compared to $6.9 million for the prior-year period. The increase in free cash flow was primarily due to higher net cash provided by operating activities.
Reaffirm Outlook for 2019 (forward-looking statement)
For the year ending December 31, 2019, Clarivate expects:
- Adjusted Revenues in a range of $962 million to $995 million
- Adjusted EBITDA in a range of $290 million to $310 million
- Adjusted EBITDA margins of approximately 30%
We expect that annualized run-rate cost savings, net of actual cost savings realized, related to restructuring and other cost savings initiatives undertaken during 2019 (exclusive of any cost reductions in our estimated standalone operating costs) will approximate $12 million.
Additionally, we expect the difference between our actual standalone company infrastructure costs, and our estimated steady state standalone operating costs for 2019 to approximate $31 million.
The above outlook assumes no further currency movements, acquisitions, divestitures, or unanticipated events. See discussion of non-GAAP financial measures at the end of this release.
Conference Call and Webcast
Clarivate will host a conference call and webcast to review the results for the second quarter on Wednesday, August 7th at 8:00 a.m. Eastern Time. The conference call will be simultaneously webcast on the Investor Relations section of the company’s website. Interested parties may access the live audio broadcast by dialing 1-888-317-6003 in the United States, 1-412-317-6061 for international, and 1-866-284-3684 in Canada. The conference ID number is 9369284. An audio replay will be available approximately two hours after the completion of the call at 1-877-344-7529 in the United States, 1-412-317-0088 for international, and 1-855-669-9658 in Canada. The Replay Conference ID number is 10133148. The recording will be available for replay through August 21, 2019. The webcast can be accessed at https://services.choruscall.com/links/ccc190807.html and will be available for replay.
Investor Day Conference on November 12, 2019
Clarivate will host an Investor Day Conference in New York City on Tuesday, November 12, 2019. Management will provide an update of the business with presentations starting at 12:00 p.m. ET and concluding at 4:00 p.m. ET. Registration will be required to attend the event which will be simultaneously webcast on the Investor Relations section of the company’s website. If you wish to be considered for attendance to the Investor Day Conference, please contact investor.relations@clarivate.com
Use of Non-GAAP Financial Measures
Non-GAAP results are presented only as a supplement to our financial statements based on U.S. generally accepted accounting principles (“GAAP”). Non-GAAP financial information is provided to enhance the reader’s understanding of our financial performance, but none of these non-GAAP financial measures are recognized terms under GAAP and should not be considered in isolation from, or as a substitute for, financial measures calculated in accordance with GAAP.
Definitions and reconciliations of the non-GAAP measures, such as adjusted revenues, adjusted EBITDA and free cash flow to the most directly comparable GAAP measures are provided within the schedules attached to this release. This communication also includes certain forward-looking non-GAAP financial measures. Clarivate Analytics is unable to present a reconciliation of this forward-looking non-GAAP financial information because management cannot reliably predict all of the necessary components of such measures, and such measures are not available without unreasonable effort. Accordingly, investors are cautioned not to place undue reliance on this information.
Forward-Looking Statements
This communication contains “forward-looking statements” as defined in the Private Securities Litigation Reform Act of 1995. These statements, which express management’s current views concerning future business, events, trends, contingencies, financial performance, or financial condition, appear at various places in this communication and may use words like “aim,” “anticipate,” “assume,” “believe,” “continue,” “could,” “estimate,” “forecast,” “future,” “goal,” “intend,” “likely,” “may,” “might,” “plan,” “potential,” “predict,” “project,” “see,” “seek,” “should,” “strategy,” “strive,” “target,” “will,” and “would” and similar expressions, and variations or negatives of these words. Examples of forward-looking statements include, among others, statements we make regarding: guidance and predictions relating to expected operating results, such as revenue growth and earnings; strategic actions such as acquisitions, joint ventures, and dispositions, the anticipated benefits therefrom, and our success in integrating acquired businesses; anticipated levels of capital expenditures in future periods; our ability to successfully realize cost savings initiatives and transition services expenses; our belief that we have sufficiently liquidity to fund our ongoing business operations; expectations of the effect on our financial condition of claims, litigation, environmental costs, contingent liabilities, and governmental and regulatory investigations and proceedings; and our strategy for customer retention, growth, product development, market position, financial results, and reserves. Forward-looking statements are neither historical facts nor assurances of future performance. Instead, they are based only on management’s current beliefs, expectations, and assumptions regarding the future of our business, future plans and strategies, projections, anticipated events and trends, the economy, and other future conditions. Because forward-looking statements relate to the future, they are difficult to predict and many of which are outside of our control. Important factors that could cause our actual results and financial condition to differ materially from those indicated in the forward-looking statements are more fully discussed under the caption “Risk Factors” in the proxy statement/prospectus as filed with the U.S. Securities and Exchange Commission (“SEC”) on April 26, 2019 (File No. 333-229899), along with our other filings with the SEC. However, those factors should not be considered to be a complete statement of all potential risks and uncertainties. Forward-looking statements, are based only on information currently available to our management and speaks only as of the date of this communication. We do not assume any obligation to publicly provide revisions or updates to any forward-looking statements, whether as a result of new information, future developments or otherwise, should circumstances change, except as otherwise required by securities and other applicable laws. Please consult our public filings with the SEC or on our website at www.clarivate.com.
About Clarivate Analytics
Clarivate Analytics™ is a global leader in providing trusted insights and analytics to accelerate the pace of innovation. We have built some of the most trusted brands across the innovation lifecycle, including Web of Science™, Cortellis™, Derwent™, CompuMark™, MarkMonitor™ and Techstreet™. Today, Clarivate Analytics is on a bold entrepreneurial mission to help our clients reduce the time from new ideas to life-changing innovations. For more information, please visit clarivate.com.
Reconciliation to Certain Non-GAAP Measures
Adjusted Revenues, Adjusted Subscription Revenues and Adjusted Transactional Revenues
We present Adjusted Revenues, which excludes the impact of the deferred revenues purchase accounting adjustment (recorded in connection with the 2016 Transaction) and the revenues from the IPM Product Line prior to its divestiture. We also present Adjusted Subscription and Adjusted Transactional Revenues, which excludes the revenues from the IPM Product Line prior to its divestiture. We present these measures because we believe it is useful to readers to better understand the underlying trends in our operations.
Our presentation of Adjusted Revenues, Adjusted Subscription Revenues and Adjusted Transactional Revenues is presented for informational purposes only and is not necessarily indicative of our future results. You should compensate for these limitations by relying primarily on our U.S. GAAP results and only using non-GAAP measures for supplementary analysis.
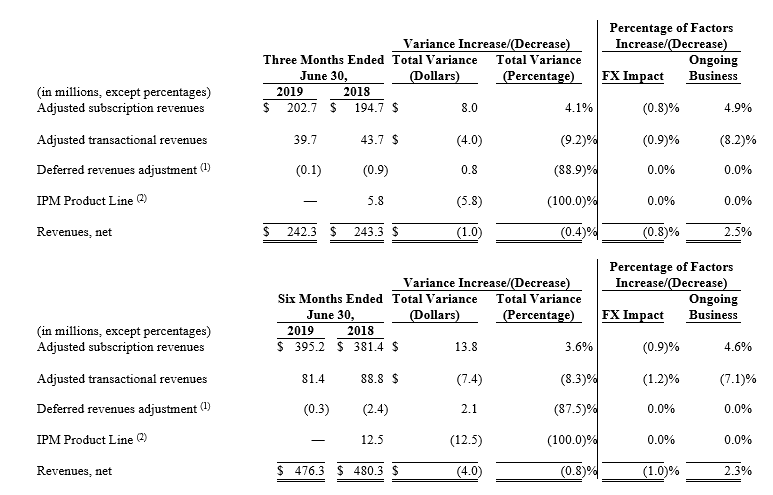
The following table presents our calculation of Adjusted Revenues for the three and six months ended June 30, 2019 and 2018 and a reconciliation of this measure to our Revenues, net for the same periods:
![]()
The following table presents our calculation of Adjusted Subscription Revenues and Adjusted Transactional Revenues for the three and six months ended June 30, 2019 and 2018:
![]()
Adjusted EBITDA
We believe Adjusted EBITDA is useful to investors because similar measures are frequently used by securities analysts, investors, ratings agencies and other interested parties to evaluate our competitors and to measure the ability of companies to service their debt. Our definition of and method of calculating Adjusted EBITDA may vary from the definitions and methods used by other companies, which may limit their usefulness as comparative measures. We calculate Adjusted EBITDA by using net (loss) income before provision for income taxes, depreciation and amortization and interest income and expense adjusted to exclude acquisition or disposal-related transaction costs (such costs include net income from continuing operations before provision for income taxes, depreciation and amortization and interest income and expense from the IPM Product Line which was divested in October 2018), losses on extinguishment of debt, stock-based compensation, unrealized foreign currency gains/(losses), Transition Services Agreement costs, separation and integration costs, transformational and restructuring expenses, acquisition-related adjustments to deferred revenues, non-cash income/(loss) on equity and cost method investments, non-operating income or expense, the impact of certain non-cash and other items that are included in net income for the period that the Company does not consider indicative of its ongoing operating performance, and certain unusual items impacting results in a particular period.
Our presentation of Adjusted EBITDA should not be construed as an inference that our future results will be unaffected by any of the adjusted items, or that our projections and estimates will be realized in their entirety or at all. In addition, because of these limitations, Adjusted EBITDA should not be considered as a measure of liquidity or discretionary cash available to us to fund our cash needs, including investing in the growth of our business and meeting our obligations. You should compensate for these limitations by relying primarily on our U.S. GAAP results and only use Adjusted EBITDA for supplementary analysis.
The following table presents our calculation of Adjusted EBITDA for the three and six months ended June 30, 2019 and 2018 and reconciles these measures to our Net loss for the same periods:
(1) Includes accruals for payments to Thomson Reuters under the Transition Services Agreement. These costs are expected to decrease substantially in 2019, as we are in the final stages of implementing our standalone company infrastructure.
(2) Includes costs incurred after the 2016 Transaction relating to the implementation of our standalone company infrastructure and related cost-savings initiatives. These costs include mainly transition consulting, technology infrastructure, personnel and severance expenses relating to our standalone company infrastructure, which are recorded in Transition, integration, and other line-item of our income statement, as well as expenses related to the restructuring and transformation of our business following the 2016 Transaction, mainly related to the integration of separate business units into one functional organization and enhancements in our technology.
(3) Reflects deferred revenues fair value accounting adjustment arising from purchase price allocation in connection with the 2016 Transaction.
(4) Includes consulting and accounting costs associated with the Transactions in 2019, the sale of the IPM Product Line and tuck-in acquisitions.
(5) Reflects the IPM Product Line’s operating margin, excluding amortization and depreciation, prior to its divestiture in October 2018.
(6) Includes primarily the net impact of foreign exchange gains and losses related to the re-measurement of balances and other one-time adjustments.
Free Cash Flow (non-GAAP measure)
We use free cash flow in our operational and financial decision-making and believe free cash flow is useful to investors because similar measures are frequently used by securities analysts, investors, ratings agencies and other interested parties to evaluate our competitors and to measure the ability of companies to service their debt.
Our presentation of free cash flow should not be construed as a measure of liquidity or discretionary cash available to us to fund our cash needs, including investing in the growth of our business and meeting our obligations. You should compensate for these limitations by relying primarily on our U.S. GAAP results.
We define free cash flow as net cash provided by operating activities less capital expenditures. The following table reconciles our non-GAAP free cash flow measure to net cash provided by operating activities:
Required Reported Data
Standalone Adjusted EBITDA
We are required to report Standalone Adjusted EBITDA pursuant to the reporting covenants contained in the Company’s credit agreement, dated as of October 3, 2016, governing the Term Loan Facility and the Revolving Credit Facility, as amended and/or supplemented from time to time (the “Credit Agreement”) and the indenture governing the Company’s Notes (the “Indenture”). Standalone Adjusted EBITDA is identical to Consolidated EBITDA and EBITDA as such terms are defined under the Credit Agreement and the Indenture, respectively. In addition, the Credit Agreement and the Indenture contain certain restrictive covenants that govern debt incurrence and the making of restricted payments, among other matters. These restrictive covenants utilize Standalone Adjusted EBITDA as a primary component of the compliance metric governing our ability to undertake certain actions otherwise proscribed by such covenants. Standalone Adjusted EBITDA reflects further adjustments to Adjusted EBITDA for cost savings already implemented and excess standalone costs.
Because Standalone Adjusted EBITDA is required pursuant to the terms of the reporting covenants under the Credit Agreement and the Indenture and because this metric is relevant to lenders and noteholders, management considers Standalone Adjusted EBITDA to be relevant to the operation of its business. It is also utilized by management and the compensation committee of the Board as an input for determining incentive payments to employees.
Excess standalone costs are the difference between our actual standalone company infrastructure costs, and our estimated steady state standalone infrastructure costs. We make an adjustment for the difference because we have had to incur costs under the Transition Services Agreement, dated July 10, 2016, between Thomson Reuters U.S. LLC and Camelot UK Bidco Limited, an indirect wholly-owned subsidiary of the Company, as amended (the “Transition Services Agreement”)after we had implemented the infrastructure to replace the services provided pursuant to the Transition Services Agreement, thereby incurring dual running costs. Furthermore, there has been a ramp up period for establishing and optimizing the necessary standalone infrastructure. Since our separation from Thomson Reuters, we have had to transition quickly to replace services provided under the Transition Services Agreement, with optimization of the relevant standalone functions typically following thereafter. Cost savings reflect the annualized “run rate” expected cost savings, net of actual cost savings realized, related to restructuring and other cost savings initiatives undertaken during the relevant period.
Standalone Adjusted EBITDA is calculated under the Credit Agreement and the Indenture by using our Consolidated Net Income for the trailing twelve month period (defined in the Credit Agreement and the Indenture as our GAAP net income adjusted for certain items specified in the Credit Agreement and the Indenture) adjusted for items including: taxes, interest expense, depreciation and amortization, non-cash charges, expenses related to capital markets transactions, acquisitions and dispositions, restructuring and business optimization charges and expenses, consulting and advisory fees, run-rate cost savings to be realized as a result of actions taken or to be taken in connection with an acquisition, disposition, restructuring or cost savings or similar initiatives, “run rate” expected cost savings, operating expense reductions, restructuring charges and expenses and synergies related to the transition following the separation of the Company’s business from Thomson Reuters (the “2016 Transaction”) projected by us, costs related to any management or equity stock plan, other adjustments that were presented in the offering memorandum used in connection with the issuance of the Notes and earnout obligations incurred in connection with an acquisition or investment.
The following table bridges Adjusted EBITDA to Standalone Adjusted EBITDA, as Adjusted EBITDA reflects all but two of the adjustments that comprise Standalone Adjusted EBITDA for the periods presented:
(1) Includes accruals for payments to Thomson Reuters under the Transition Services Agreement. These costs are expected to decrease substantially in 2019, as we are in the final stages of implementing our standalone company infrastructure.
(2) Includes costs incurred in connection with and after the 2016 Transaction relating to the implementation of our standalone company infrastructure and related cost-savings initiatives. These costs include mainly transition consulting, technology infrastructure, personnel and severance expenses relating to our standalone company infrastructure, which are recorded in the Transition, integration, and other line-item of our income statement, as well as expenses related to the restructuring and transformation of our business following the 2016 Transaction, mainly related to the integration of separate business units into one functional organization and enhancements in our technology.
(3) Reflects deferred revenues fair value accounting adjustment arising from purchase price allocation in connection with the 2016 Transaction.
(4) Includes consulting and accounting costs associated with the Transactions in 2019, the sale of the IPM Product Line and tuck-in acquisitions.
(5) Reflects the write down of a tax indemnity asset.
(6) Reflects the IPM Product Line’s operating margin, excluding amortization and depreciation, prior to its divestiture in October 2018.
(7) Includes primarily the net impact of foreign exchange gains and losses related to the re-measurement of balances and other one-time adjustments.
(8) Reflects the estimated annualized run-rate cost savings, net of actual cost savings realized, related to restructuring and other cost savings initiatives undertaken during the period (exclusive of any cost reductions in our estimated standalone operating costs).
(9) Reflects the difference between our actual standalone company infrastructure costs, and our estimated steady state standalone operating costs, which were as follows:
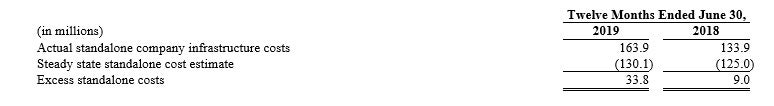
The foregoing adjustments (8) and (9) are estimates and are not intended to represent pro forma adjustments presented within the guidance of Article 11 of Regulation S-X. Although we believe these estimates are reasonable, actual results may differ from these estimates, and any difference may be material. See “Cautionary Note Regarding Forward-Looking Statements”
Supplemental Revenue Disclosure
The following tables present the amounts of our subscription and transactional revenues, including as a percentage of our total revenues, for the periods indicated, as well the drivers of the variances between periods.
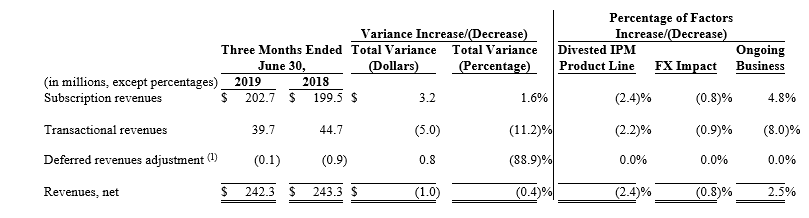
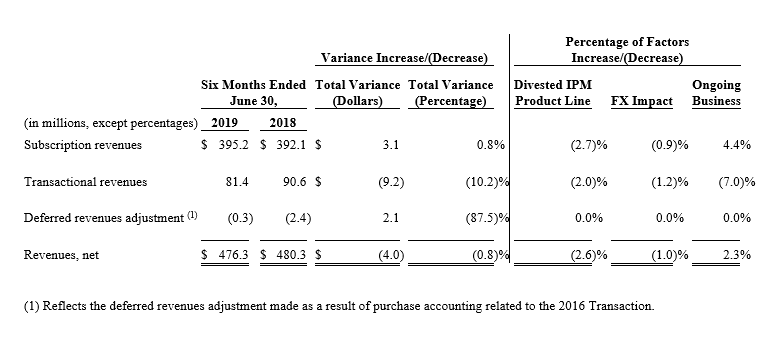
(1) Reflects the deferred revenues adjustment made as a result of purchase accounting related to the 2016 Transaction.
(2) Reflects the revenue generated by the IPM Product Line for the three and six month periods ended June 30, 2018. We sold the IPM Product Line on October 3, 2018. IPM Product Line revenue was concentrated in North America.
The following tables, and the discussion that follows, presents our revenues by Group for the periods indicated, as well the drivers of the variances between periods, including as a percentage of such revenues.
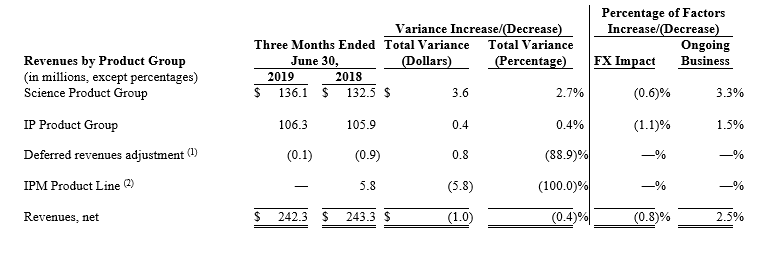
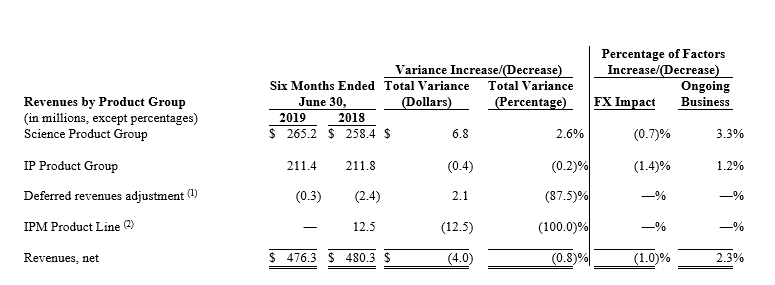
(1) Reflects the deferred revenues adjustment made as a result of purchase accounting related to the 2016 Transaction.
(2) Reflects the revenue generated by the IPM Product Line for the three and six month periods ended June 30, 2018. We sold the IPM Product Line on October 3, 2018. IPM Product Line revenue was concentrated in North America.
Second Quarter 2019 Business Highlights
Company
- Opened a new office in Guangzhou, China, to accelerate growth in South China. This is the fifth Clarivate office in Greater China and reflects the importance of China in the company’s global growth strategy.
Science Group
- Released the Web of Science 2019 Journal Citation Reports, revealing the world’s most influential journals.
- The Web of Science Group launched new publisher analytics reports that provide a snapshot of journals’ performance and inform competitor analysis.
- Signed agreement with Melbourne Biomedical Precinct to provide comprehensive drug trial discovery intelligence via Cortellis.
- Introduced Simplified Chinese user interface for its Cortellis suite of Life Science Intelligence solutions
Intellectual Property Group
- Launched Trademark.com, an all-in-one trademark protection tool, to make safeguarding brands easy and affordable for small business owners.
- Partnered with Hitachi in Japan to enable Hitachi’s Shareresearch solution to deliver access to translated Derwent World Patents Index content and improving the efficiency of global patent research, review and evaluation processes.
- Standards Australia partnered with Techstreet to deliver greater access and choice for users of Australian Standards®.
- Announced strategic partnership between CompuMark and WebTMS, enabling WebTMS users to access CompuMark’s 186 trademark databases.
Source: Clarivate Analytics
Media Contact:
Tabita Seagrave, Head of External Communications
Investor Relations Contact:
Anthony Gerstein, Head of Investor Relations


