On June 26th, Journal Citation Reports was released with both the new 2017 data and innovative levels of transparency and journal intelligence captured in an enhanced journal profile page. This blog article looks at the new profile page features.
The new journal profile page tells a story about that journal. At the very top is the same background information we have always shown: journal title, publisher, categories, languages, publication frequency, and links to the Table of Contents. Data for prior years are accessed by the “All Years” tab or in the Source Data table.
Journal Impact Factor in context over time
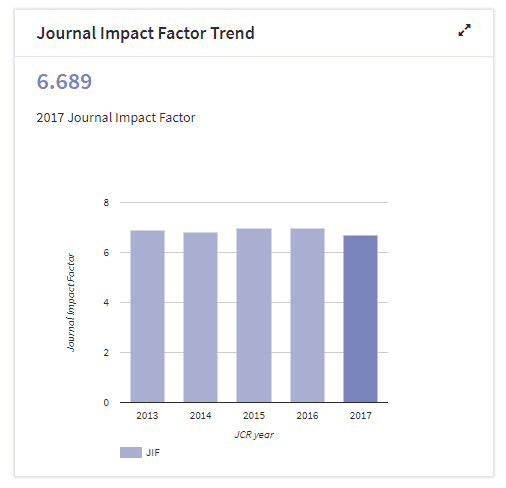
Directly below that are two items that give context to the Journal Impact Factor (JIF) score: the Journal Impact Factor Trend and the Citation distribution.
The JIF trend graph shows the past five years of JIF scores, for an immediate picture of JIF performance over time. Is the journal steady? Has it dipped or peaked? The graph can be expanded for a larger view.
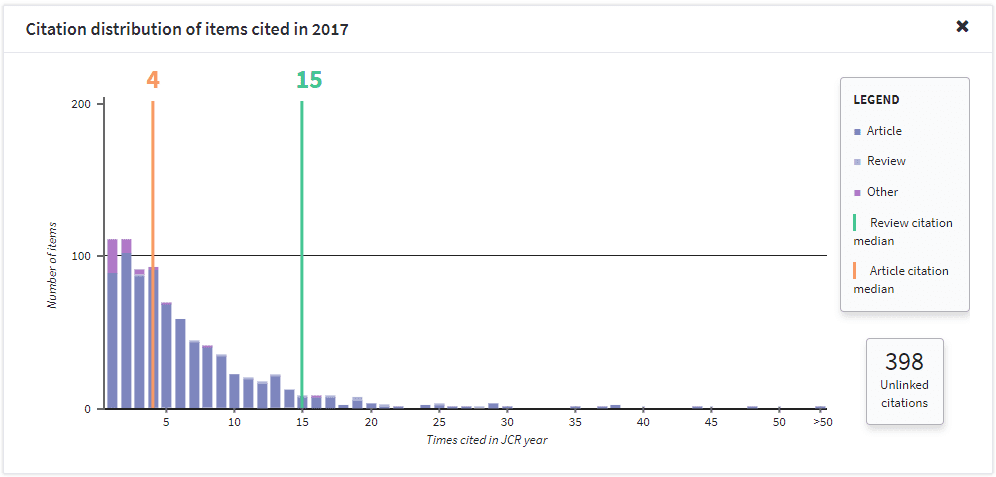
The citation distribution is a histogram that shows the citation pattern for all items included in the JIF calculation. Where are the bulk of cited items? Are there any outliers? What are the median citation rates for articles and reviews? Medians are critical values in a skewed distribution. This graph also takes “unlinked citations” into account – these are citations to a journal that have incomplete data at the paper level, but are still included in the JIF calculation. Below is the expanded view of this graph:
Journal Impact Factor transparency
This year, we are pleased to provide even more transparency about the calculation of the Journal Impact Factor (JIF). Not only is the math fully spelled out, as it always has been, but we now also provide the full numerator and denominator items for users to examine, export, and even view in Web of Science to further analyze.
This year, we are pleased to provide even more transparency about the calculation of the Journal Impact Factor.
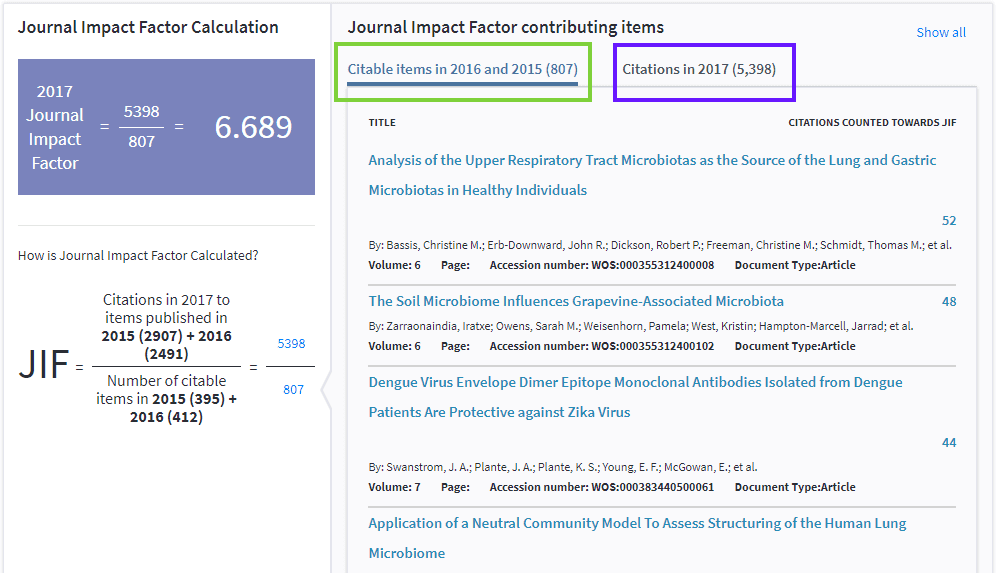
Full JIF transparency
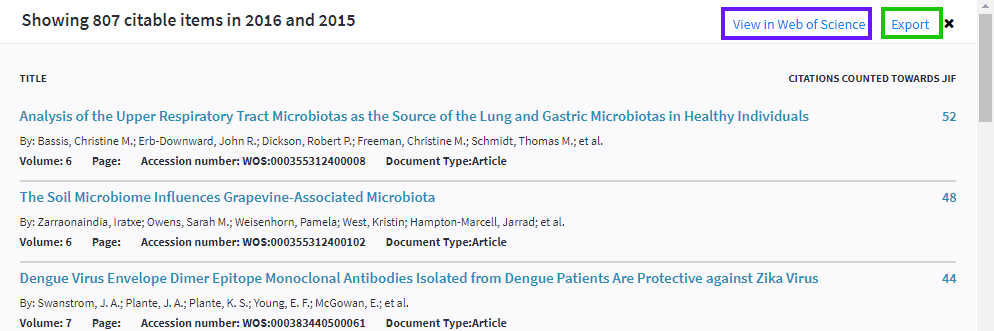
Full view of citable items; can be viewed in the Web of Science and downloaded
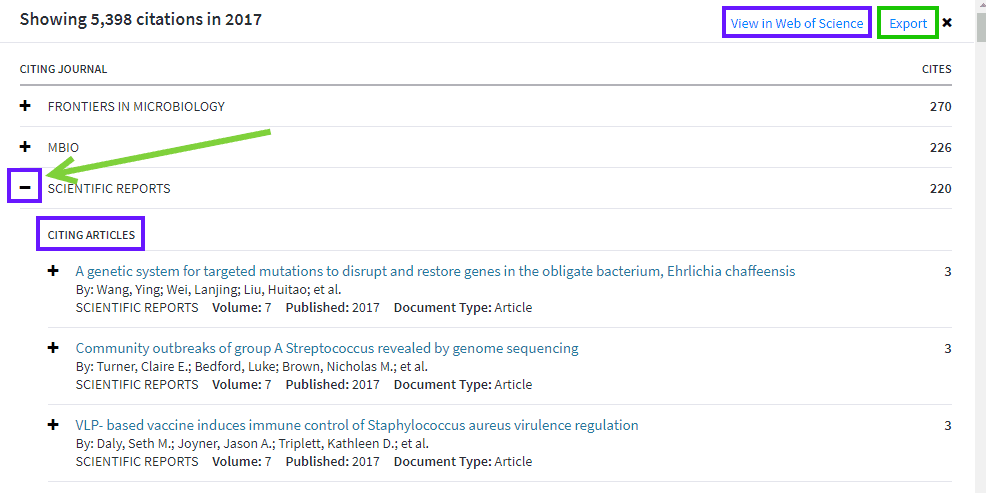
Full view of citations; can be viewed in the Web of Science and downloaded
Regional and organizational contributions
At the bottom of the profile page, you will see two tables: Contributions by country/region; and Contributions by organizations. The former shows the countries or regions that have contributed the most papers to the journal in question in the most recent three-year period (i.e., the years used to calculate the JIF) and the latter shows the organizations contributing the same. These are considered journal characteristics: they are descriptors about that one particular journal, and are not meant to be used comparatively among journals. Both tables can be expanded for a more complete view and can be exported.
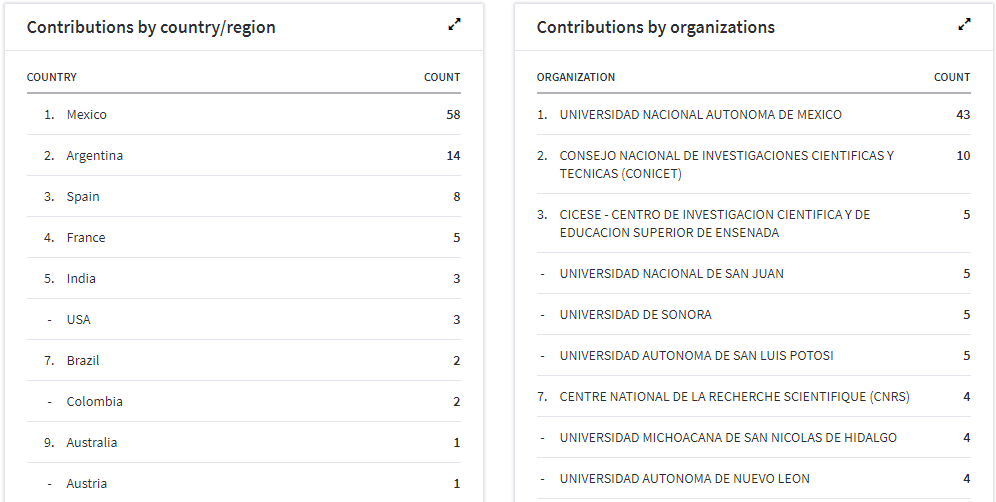
View the top contributing countries/regions and organizations
Learn more about this year’s JCR release
- Watch our new video
- Attend a live training session
- Attend our webinar on July 9th: Every Journal has a Story to Tell: The JCR 2018 Release


Related insights
The latest news, technologies, and resources from our team.