How the addition of beamplots to the Web of Science will provide researchers and evaluators with contextual insights around individual researcher performance
The Web of Science™ Author Impact Beamplots are a new visualization tool that showcase the range of a researcher’s publication and citation impact in a single data exhibit. It is well-aligned with wider community efforts to reform research assessment and encourage the responsible use of metrics as it makes use of a field-normalized citation metric, does not unduly penalize researchers with gaps in their publication record, or disadvantage those who work in fields with distinctly different publication activity.
More than a metric?
Publication and citation metrics have become more common in determining academic appointments, promotions and funding and many researchers are rightly concerned about approaches that reduce their work to a single-number performance score. Continued dependence on simple and inadequate metrics has led to indicator impoverishment and lack of awareness of best practices.
A beamplot shows the volume and citation impact of an individual’s publication portfolio through time.
In contrast to the h-index, which tends to favor senior researchers that work in the physical sciences, a beamplot shows the volume and citation impact of an individual’s publication portfolio through time. Each paper’s citation count is normalized (i.e., benchmarked against other similar publications from the same discipline) and measured as a percentile. It is also not necessarily biased against individuals who have taken a career break or published less at any given time.
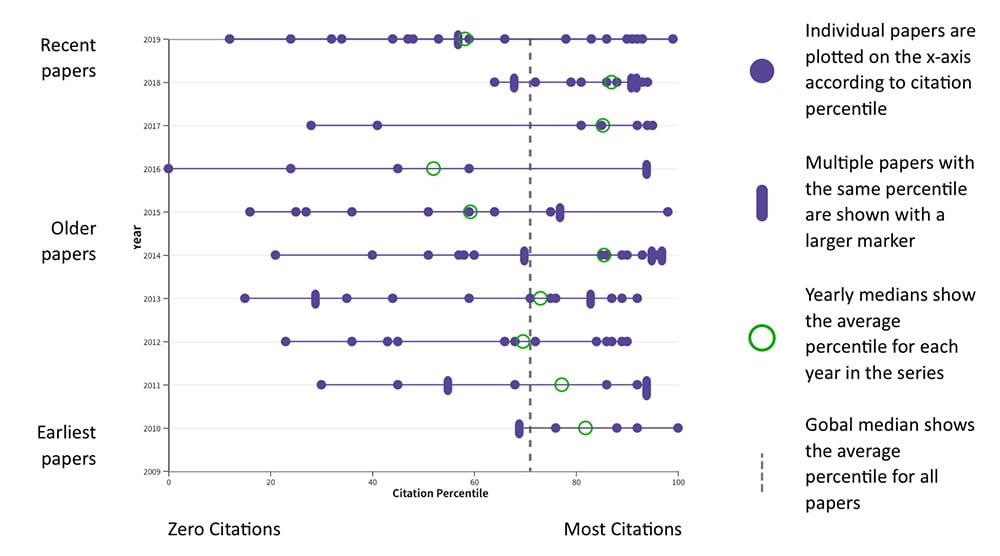
Importantly, beamplots reveal the data behind composite scores such as the h-index, show the underlying data on a paper-by-paper basis and provide a picture of performance over time. Seeing the data in this way puts a researcher’s publications into a context suitable for comparison and unpacks the citation performance of their publication portfolio.
All of these elements help to address many criticisms of the h-index and support our stance on using profiles rather than metrics. But perhaps more importantly, we believe that this tool will encourage those who use researcher metrics to consider what is actually behind the metric and to engage more actively with the data.
Promoting responsible research evaluation
The data visualized in beamplots steer us away from reduction to a single-point metric and force us to consider why the citation performance is the way it is.
Beamplots are particularly good at surfacing variation in the data that should be investigated and compared against other quantitative and qualitative indicators. In this way, they are a useful narrative tool that can refute or corroborate other evaluation criteria.
It’s crucial to remember that although publication and citation data are useful indicators of research activity and impact, they must be considered alongside the many other contributions that academics make and placed in proper context for each individual. This might include where they were working at the time, the nature of any collaborative projects and the type of research involved.
It is clear to us that, if used responsibly, a beamplot will help remove the current dependence on existing single-point metrics, eliminate indicator impoverishment and raise awareness of responsible research evaluation practices. We encourage people who use researcher metrics to consider what actually makes a metric and to engage more actively with the data in order to provide new opportunities to conduct research evaluation in a responsible way.
Our whitepaper from the Institute for Scientific Information (ISI)™ explores this useful metric and gives guidance on how it can be used in the right context to promote responsible research evaluation.